logo
Login Open an Account

200invest charts

Improve your chances for a successful trade with our intelligent tools!
A variety of research tools are available to customers of the trading site 200invest. Traders can view information about their trades and other traders’ transactions in the market, including stock and currency pairs, by using the many charts that are available on our website. You have the ability to monitor other crucial information that might assist them in making more informed trading decisions!

charts

Types of charts offered by 200invest

The line chart
Beginner traders can use a line chart as a basic tool to see how prices are moving. It has the advantage of clearly displaying technical patterns, which simplifies things for novice stock or asset traders. With only a single line connecting point, they can determine what kind of pattern requires attention at any given moment!

chart-1

The bar chart
Any financial instrument's opening, closing, and high-low prices over time can be easily seen with a bar chart. Each vertical bar's top point shows the price at which it was traded at its peak, and the bottom markers reveal the locations of its low points as well. Bar charts are primarily utilized by traders seeking to ascertain whether their investments have experienced an upswing or decline. However, they can also be useful for broader trend exploration, as they display both bullish and bearish patterns, with inside edge lines suggesting potential movement in either direction.

chart-2

The candlestick chart
Although the candlestick chart is frequently referred to as the most complex kind of technical analysis, it also offers a number of advantages. Traders, especially those who trade frequently or are interested in doing so, will find it easier to predict potential price movements for any financial instrument based on historical patterns and trends when these types are combined.

chart-3

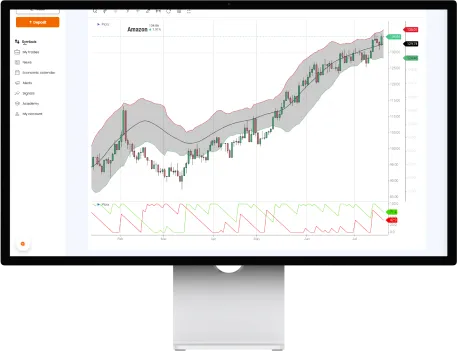
How important is chart reading?

The secret to successful trading is understanding charts. This is the hub where all of your data is combined to create a tool that will help you make smarter investing decisions faster, which translates into more money!
When interpreted correctly, the charts show patterns and highlight opportunities that others may have missed because they lack the knowledge necessary to trade.

These days, it takes too much work to search through multiple sources while staying up to date with current events, but it doesn’t mean we should completely give up on staying informed.

monitor-chart-2

If this has already motivated
you, please fill out our
registration form.

VisaMastercard logoMaestro logoSkrill-lightGroup 67XMLID_34_Google_Pay_Logo (1) 1bank-transfer